Why this matters: every business decision is really a causal one
How to split a marketing budget. Whether to hire two more engineers. Whether to cut a product's price. Each of these is a causal question in disguise: if we change this input, what happens to the output we care about? Acting well requires an answer. Acting poorly is what happens when the answer is wrong.
The trouble is that the data those decisions are made on (CRMs, ad reports, warehouses, dashboards) is almost entirely observational: it records what happened alongside what else was happening, with no clean separation between cause and consequence. Spend more on a channel during a busy quarter and the channel looks productive; run a campaign during a competitor's stumble and the campaign looks like it worked. Standard regression on observational data conflates the two, and most marketing and finance dashboards sit downstream of standard regression. The decision-maker walks away with a number that looks causal and isn't. The way out is deliberate variation, A/B tests, geo holdouts, on/off rotations, anything that breaks the natural correlation between treatment and outcome. Few teams actually do it.
Why marketing attribution is the cleanest example
This same pattern shows up wherever allocations meet measurements. Marketing attribution is the loudest version, for two reasons. First, the spend is enormous: US digital advertising is now ~$300B a year, global digital ad spend is north of $700B, and a misattributed channel keeps "earning" credit it didn't actually earn, so the error compounds with reinvestment.
Second, the measurement is uniquely confounded. Major channels like search and social are auctions, so bid prices respond to your own demand and spending more makes a channel look more efficient. Customers are exposed to multi-touch sequences (display Monday, search Tuesday, email Wednesday) and the same conversion can be credited to any of them depending on the attribution rule. Adstock (the lagged effect of spend on later revenue) means today's campaign reshapes next month's numbers, well after anyone is looking. The two main causal-inference fixes (marketing mix modeling and incrementality testing) both have well-known ways to fail.
Where AI fits in
LLMs are increasingly being placed inside business decision loops as copilots, agents, advisors, and dashboards-with-chat. If they are going to advise on resource allocation, they have to navigate exactly this problem: read noisy aggregated data, infer causal structure under partial observability, and avoid conflating "the channel was up because we were up" with "spending more there will push us up." This study puts 29 LLMs (frontier and mid-tier, $0.20/run and <$0.01/run, reasoning and not) into a controlled simulator of that exact loop, scores every choice against a causal oracle, and reports what we found.
The game
Every month for a year, you (or a model in your seat) allocate a $300,000 marketing budget across three channels: Discovery (top-of-funnel / brand), Conversion (direct-response), and Social (influencer). At month-end you observe just two numbers (total revenue and total customer count) and nothing else. There is no per-channel revenue breakdown, no attribution report, no audit trail of which dollar produced which conversion. You make next month's call from those two numbers and whatever you can infer about what's working. Repeat twelve times.
Scores are oracle-normalized, which means we compare your total annual revenue against what the best possible fixed monthly allocation would have produced under that seed's true (hidden) channel elasticities and adstock parameters. A score of 100% means you matched that oracle; 0% means you matched a zero-budget baseline that just runs the business with no marketing spend. The same ten seeds are used for every model, the simulator is fully deterministic, and every run can be replayed turn-by-turn. You can play one yourself in about eight minutes.
Each model is run twice on every seed: once with no analytics, where it sees only the raw monthly revenue numbers, and once with analytics, where its prompt also includes three statistical summaries computed from the simulator's internal daily stream: a correlation matrix, an OLS regression with weather and event controls, and an adstock-aware regression. The with-analytics condition is the closest the model gets to a "real" attribution dashboard. Total across the lineup: 29 models × 10 seeds × 2 conditions = 580 full 12-month trajectories.
The leaderboard is surprisingly flat at the top
Before getting into the structure of how models behave, here is the headline result: averaging across both prompt conditions, the top ten models all sit inside a single ~9-point band, and the differences between them are not as large as the gaps between vendors or generations might suggest.
| # | Model | No-an | W-an | Overall | Cost/run |
|---|---|---|---|---|---|
| 1 | claude-3.7-sonnet | 83.1 | 87.4 | 85.3 | $0.20 |
| 2 | gpt-5.4-nano | 73.7 | 92.4 | 83.0 | $0.016 |
| 3 | deepseek-v3.2 | 75.7 | 88.6 | 82.2 | $0.014 |
| 4 | gpt-4o-mini | 85.2 | 77.5 | 81.4 | $0.009 |
| 5 | claude-haiku-4.5 | 72.5 | 88.1 | 80.3 | $0.073 |
| 6 | gemini-2.5-flash | 72.5 | 84.9 | 78.7 | $0.024 |
| 7 | mixtral-8x22b | 70.2 | 84.8 | 77.5 | $0.143 |
| 8 | gemini-2.0-flash | 73.9 | 80.1 | 77.0 | $0.007 |
| 9 | qwen3-235b-a22b | 67.0 | 86.2 | 76.6 | $0.005 |
| 10 | claude-3.5-haiku | 66.1 | 86.2 | 76.1 | $0.053 |
| → full 29-model leaderboard on the live site | |||||
A few things jump out of the full data:
- The top ten models fit inside a ~9-point band (76–85%). Many of those gaps are within per-seed confidence intervals.
- Model generation matters less than you'd expect. Claude 3.7 Sonnet (an older Anthropic model) sits at #1. GPT-4o-mini beats o3-mini, gpt-5.4-mini, and gpt-4.1-mini from the same vendor.
- Reasoning models are not at the top. DeepSeek R1 and o3-mini land mid-pack despite costing 5–50× more than the leaders.
None of this means newer models are worse; it means this specific task (sequential allocation under noisy feedback) doesn't separate models the way you'd expect from MMLU or coding benchmarks. Capability differences between frontier generations get compressed when the task has a narrow optimum.
Analytics helps almost everyone
In the with-analytics condition, the model sees three regression summaries appended to its prompt before each monthly decision: a correlation matrix, an OLS fit with weather and event controls, and an adstock-aware regression. The effect across the 29-model lineup is remarkably consistent:
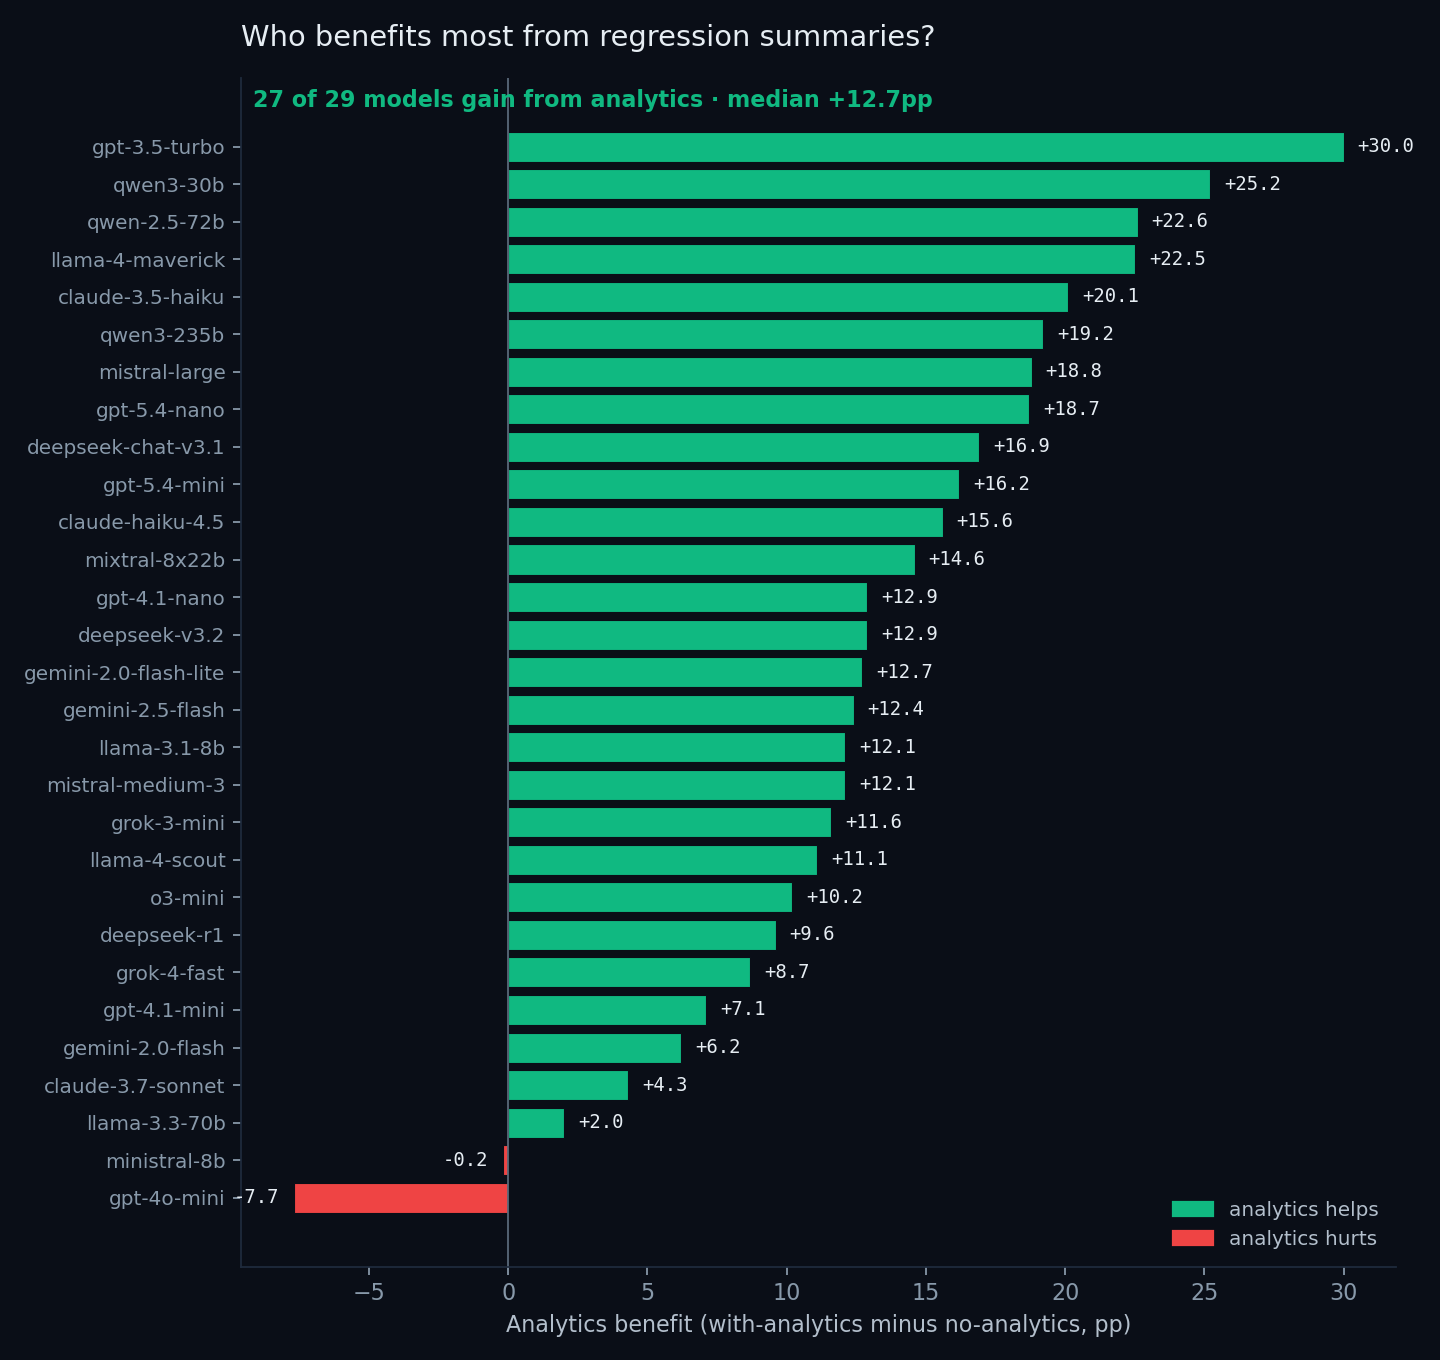
- 27 of 29 models improve. The median gain is +12.7 percentage points.
- The biggest gains come from the weakest-without-analytics models. GPT-3.5-turbo rises from 53.5% (lowest in the lineup with no analytics) to 83.5% with analytics, a 30-point swing. Qwen 3-30B, Qwen 2.5-72B, and Llama 4-Maverick all gain over 22 points.
- Only two models are not helped. Ministral-8B is statistically flat (−0.2pp). GPT-4o-mini is the outlier in the other direction: its no-analytics score (85.2%) is already the 4th-best in the whole lineup, and analytics actually lowers it to 77.5%. We return to that in the case studies below.
This is the cleanest result in the dataset: a regression summary handed to the model at each step reliably turns mid-tier models into upper-tier models. It's less clear what it's doing to the already-strong ones: sometimes nothing, sometimes a small lift, occasionally a degradation.
Cost has nothing to do with how much analytics helps
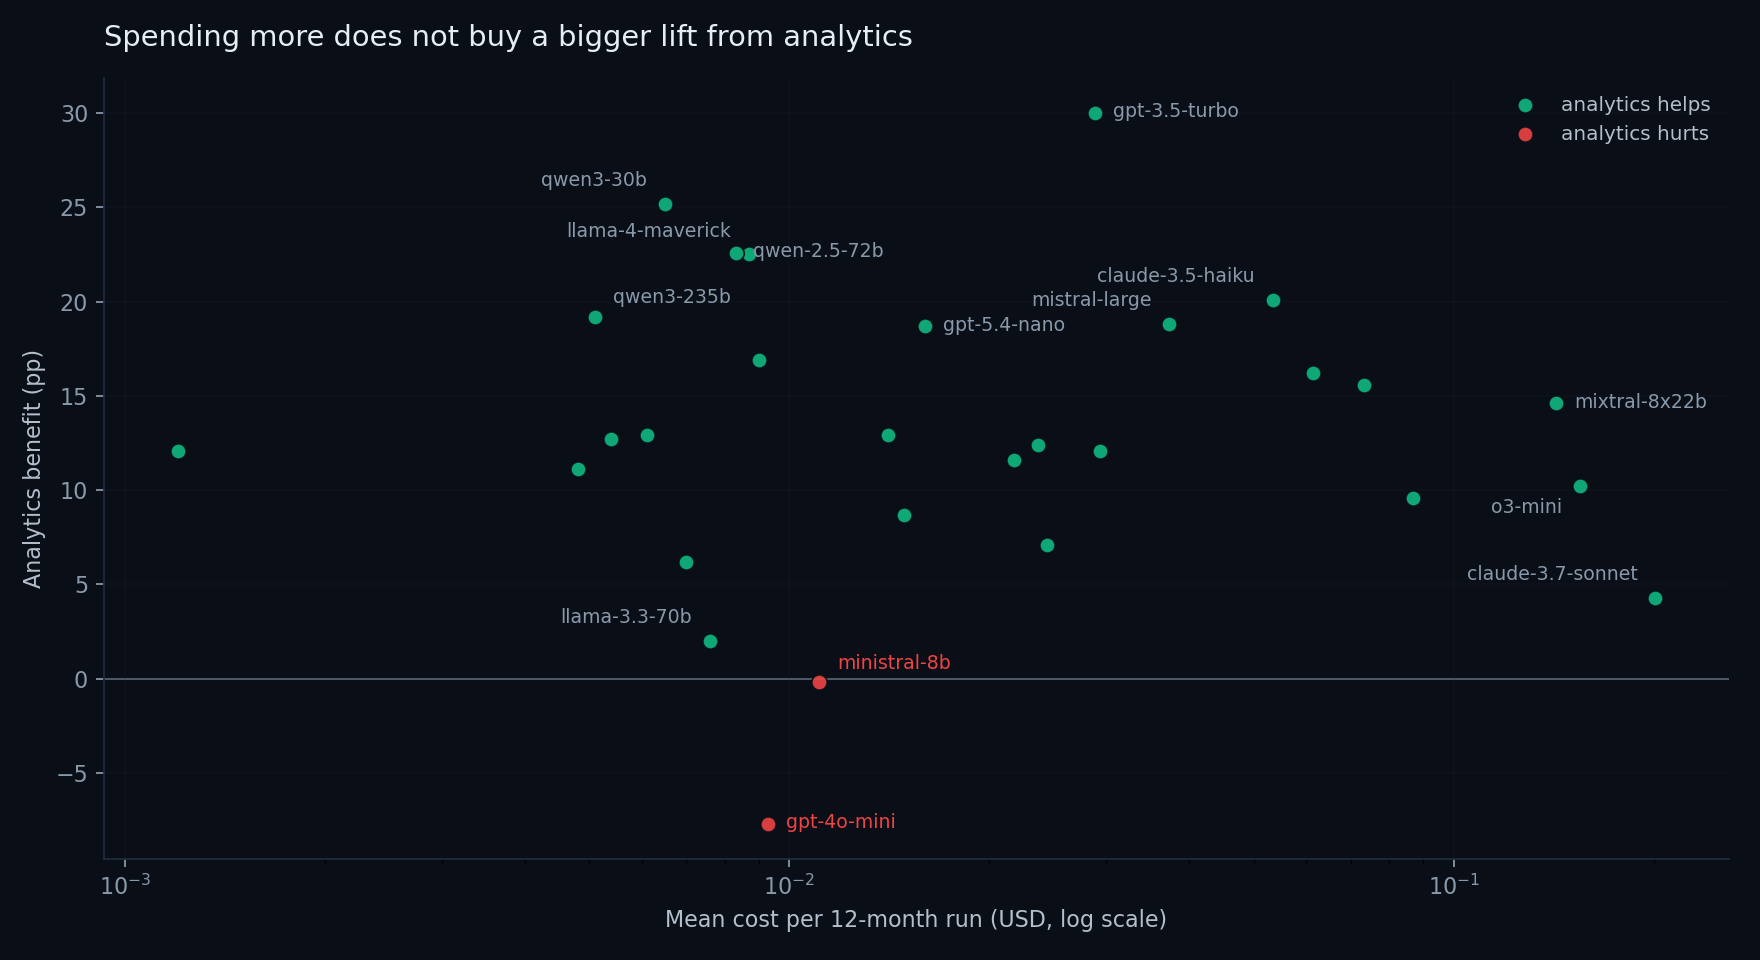
If frontier models had a built-in advantage at using a regression summary, you'd expect the y-axis to trend up with cost. It doesn't. The biggest gains belong to the cheapest weak models (GPT-3.5-turbo, Qwen 3-30B, Llama 4-Maverick) because they have the most room to grow; the most expensive model on the chart (Claude 3.7 Sonnet) sees only a +4.3pp gain because it was already strong without analytics. The lift from regression summaries is roughly orthogonal to model price.
Cost barely predicts capability on this task
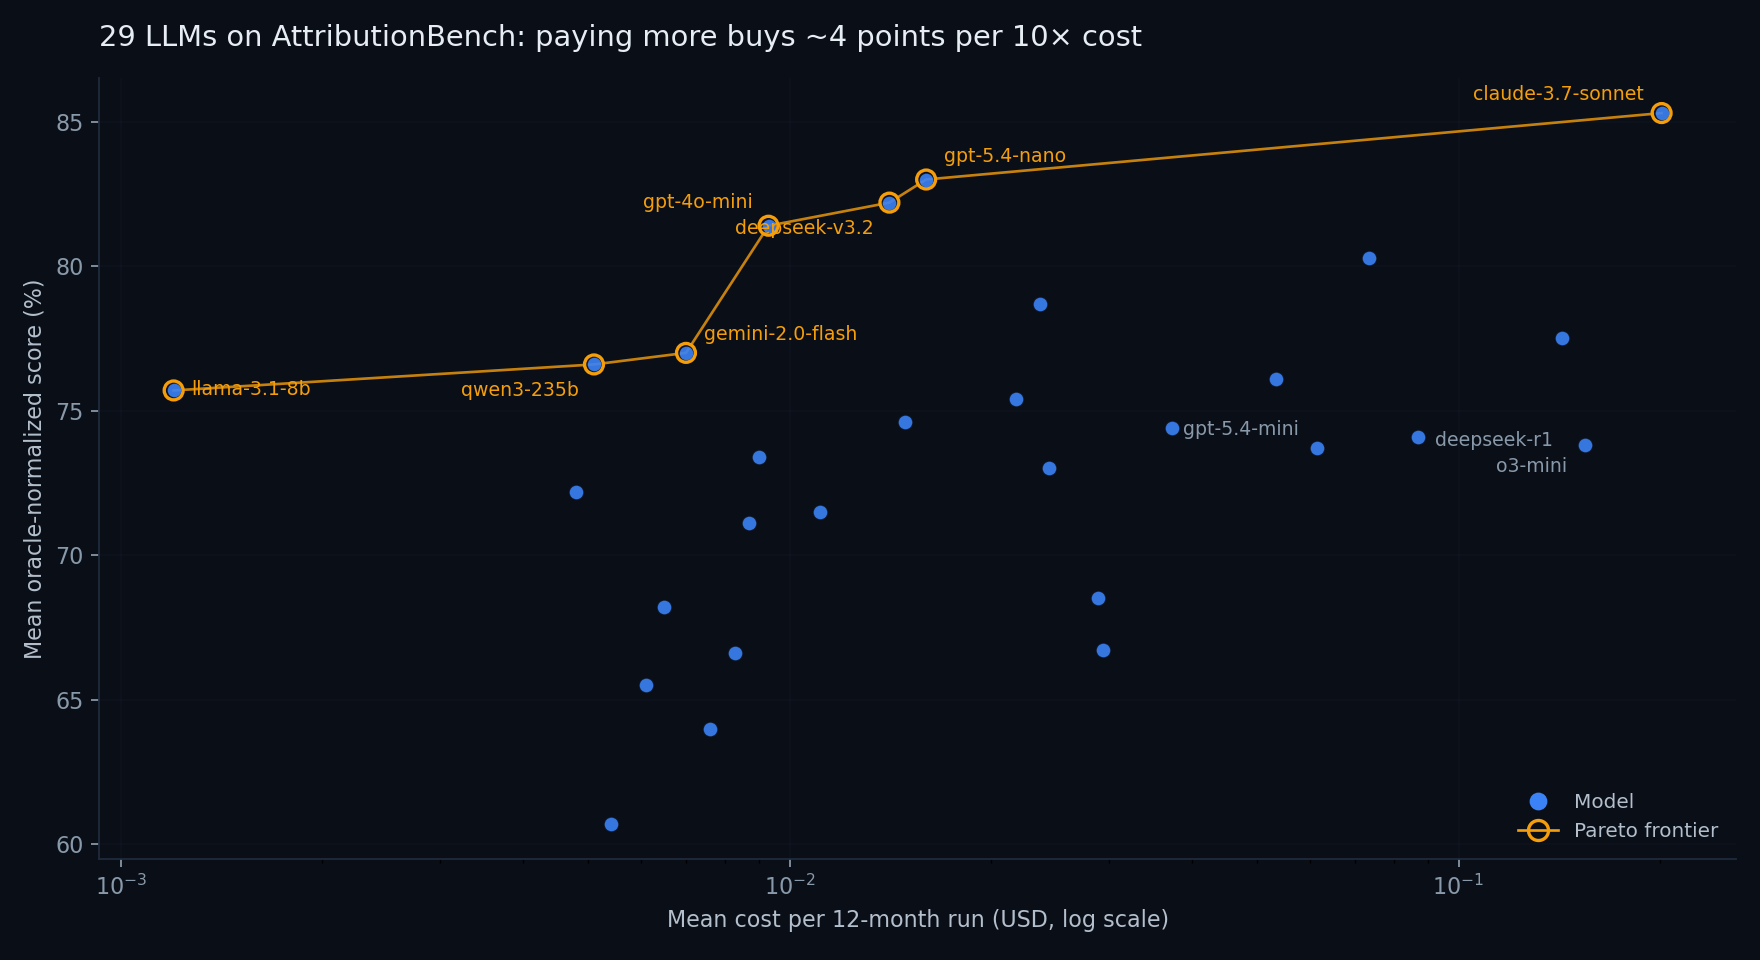
Fitting a log-linear regression gives a slope of roughly +4 points per 10× cost increase, with r = 0.36, present but weak. The Pareto frontier is only 7 models deep:
- llama-3.1-8b: $0.0012/run → 75.7%
- qwen3-235b: $0.0051/run → 76.6%
- gemini-2.0-flash: $0.0070/run → 77.0%
- gpt-4o-mini: $0.0093/run → 81.4%
- deepseek-v3.2: $0.0141/run → 82.2%
- gpt-5.4-nano: $0.0160/run → 83.0%
- claude-3.7-sonnet: $0.2012/run → 85.3%
The jump from GPT-5.4-nano at ~1.6¢/run to Claude 3.7 Sonnet at ~20¢/run buys you 2.3 percentage points. Above that, there is nothing on the frontier; every more-expensive model we tested is dominated by at least one cheaper one.
If you're deploying for production, the three points at $0.01/run (GPT-4o-mini, DeepSeek V3.2, GPT-5.4-nano) are probably where you start. Claude 3.7 Sonnet is a reasonable stretch if the last few points matter; anything above it becomes hard to justify on this task.
What going right looks like: Mixtral 8×22B, no analytics, 94.2%
Mixtral 8×22B is a 2024-era open-weight mixture-of-experts model from Mistral. Mid-pack on most modern general benchmarks, and not anyone's first pick when "best model" comes up. On this task, on seed 5, with no analytics, meaning it sees only the raw monthly revenue numbers and nothing more, it scored 94.2%. That is within striking distance of the optimal fixed allocation under the seed's true (and hidden) parameters. Here is the entire 12-month trajectory, lightly trimmed:
The mechanics are clean and readable even in hindsight, and they look exactly like a textbook adaptive policy:
- Month 1 is pure exploration. An even one-third split across all three channels with no prior claims about what works. The model is buying information.
- Month 2 is the first revision. The model notices that revenue ($224K) came in below spend ($300K) and reads that as inefficiency. It cuts Social, which it labels "experimental", and tilts toward Discovery and Conversion. The reasoning is vague ("Social spend underperformed last month") but directionally correct.
- Months 3–5 are compounding on signal. Each month, the model observes revenue rise after the previous reallocation, treats that as confirmation, and doubles down: Discovery share keeps creeping up, Social drops to zero, and Conversion holds in the middle.
- Months 6–8 are equilibrium-seeking. Small adjustments to Conversion when revenue dips, small pullbacks on Discovery when growth visibly slows. The model never swings hard, even when a month's revenue surprises it.
- Months 9–12 are maintenance. The mix has stabilized at roughly 67%/33%/0%, within spitting distance of the true oracle ratio (~73%/27%/0%). The model recognizes the plateau and stops trying to improve on it.
Everything the model "knows" about which channel actually drives revenue, it learned from the sequence of twelve monthly revenue numbers, without a regression, a correlation matrix, or any formal causal-inference machinery. The behavior isn't flashy: it is steady hypothesis revision, appropriately cautious, with large changes early (when there is the most to learn) and small changes late (after convergence). For a 2024 mid-tier open-weight model, that is a remarkably disciplined run.
What going wrong looks like: Gemini 2.5 Flash, with analytics, 45.1%
Gemini 2.5 Flash is a current-generation Google model and ranks #6 overall on the leaderboard. On most seeds it scores in the low 80s, well above mid-pack. On seed 6, with analytics turned on, it scored 45.1%, more than 30 points below its own average. This wasn't a slow drift; it was a single bad run that the model never recovered from.
What went wrong here is instructive, because it wasn't a reasoning failure in the usual sense. The model reasoned fluently throughout. It cited the regression outputs by name. It used phrases like "statistically significant" correctly. The problem is what it reasoned about.
Four things to notice about what happened in this run:
- The model trusted regressions fit on small samples. At month 2 it had only 30 days of data per channel, barely enough for any regression coefficient to mean what its standard error claims it means, and yet it formed a confident causal claim and acted on it.
- It conflated statistical significance with direction. "Positive but not significant" got read as "not real," so Conversion (which actually was the second-most-effective channel) was zeroed out and then stayed zeroed out for ten of the twelve months.
- It treated noise in coefficients as new signal. When a month-to-month regression coefficient flipped sign, a normal consequence of adding 30 noisy days of data, not a real change in the world, the model interpreted the flip as new evidence and performed the largest reallocation of the entire run away from the only channel that was actually working.
- The prose is fluent throughout. If you skimmed the trace without checking the numbers, you would think this was a well-reasoned run. The mistakes are not at the level of writing or vocabulary; they are at the level of how to use statistical outputs at all.
GPT-4o-mini's analytics-hurts pattern (rank #4 without analytics, −7.7pp once analytics is added) is the same story at a smaller scale. Without analytics, the model has already settled on roughly the right mix from informal pattern-matching on revenue. Add regression summaries and the model starts over-reacting to small-sample fluctuations in coefficients, and ends up worse than it was before.
The common thread
Analytics helps models that are poor at inferring channel effectiveness from raw revenue feedback (GPT-3.5-turbo and Qwen 3-30B are the clearest examples). It does not reliably help models that are already good at that inference, and in a handful of cases it actively makes them worse by replacing a working heuristic with an over-confident reading of a noisy regression. The lesson is not "analytics is good" or "analytics is bad", it is "analytics is a tool, and using it well requires understanding what its outputs mean and what their uncertainty is." That is itself a causal-reasoning skill, not a separate one.
Takeaways
- The capability differences between frontier models on this kind of task are smaller than you'd think. The top ten models all fit inside a ~9-point band, and many of the gaps within that band are within per-seed confidence intervals. If you are choosing a model for an applied resource-allocation task, do not expect the spec sheet, context length, parameter count, headline benchmark numbers, to be a reliable guide. Run it on your actual problem.
- Giving the model statistical analytics is a large, broadly positive lever. A short regression summary handed to the model at each decision lifts the median model by ~12 points, and lifts several mid-tier models by 20–30. That is a bigger swing than almost any model swap we ran. If your AI pipeline includes this kind of decision, instrumenting the prompt with simple causal summaries is the cheapest large improvement you can make.
- Cost tracks capability only weakly on causal-reasoning tasks. Under 2¢ per run, three models score within 2 points of the overall leaderboard leader. Reasoning-effort models like o3-mini and DeepSeek R1, despite costing 5–50× more, do not sit at the top, their step-by-step thinking does not translate into a reliable advantage on a problem of this shape.
- How a model uses a statistical tool matters as much as whether it has one. The same set of regression summaries that rescued GPT-3.5-turbo from the bottom of the lineup sent Gemini 2.5 Flash into one of the worst runs in the dataset. The difference is not size, vendor, or generation. It is whether the model knows how to wait for evidence before changing its mind.
- This is the kind of reasoning real business decisions actually require. Sequential, noisy, partially-observable, and causal. Standard LLM benchmarks do not measure it. AttributionBench is one stylized data point on what the gap looks like, and the gap is real.
Try it yourself
The same simulator the models ran against is fully playable in the browser, with the same oracle, the same scoring rule, and the same ten seeds. A run takes about eight minutes. Your final score lands on the same leaderboard as every model in this writeup, directly comparable.
Play a run Full leaderboard Repo on GitHubAppendix: how this was built
The simulator
The environment is a deterministic, seeded simulator written in plain JavaScript. Each run advances day by day for twelve months; channel allocations decided once per month flow into a daily revenue and customer-count update. Stochasticity comes from a seeded RNG that drives weather, demand noise, and a competitor cafe's behavior. The same simulator runs in the browser (so a human can play it) and in Node (so an LLM can play it), the two engine files are byte-identical, which means a model's leaderboard score and a human's leaderboard score were produced by exactly the same code path.
The oracle is computed once per seed by an exhaustive search over fixed monthly allocations under that seed's hidden parameters. Scores are normalized to that oracle and to a zero-budget baseline, so 100% means matching the best possible fixed strategy and 0% means matching no spend at all.
The LLM pipeline
All canonical leaderboard runs go through OpenRouter's OpenAI-compatible API. Routing every vendor (Anthropic, OpenAI, Google, Meta, Mistral, DeepSeek, xAI) through a single schema means every model faces an identical pipeline: same request format, same retry behavior, same provider pinning, same cost accounting. Cross-vendor comparisons stay clean.
A “run” is one full 12-month trajectory under one (model, seed, analytics-bucket) tuple, and counts as 12 model calls. A full canonical evaluation per model is 240 calls: 10 seeds × 2 analytics buckets × 12 months. The 29-model sweep behind this writeup is 580 runs (29 × 20). The model receives a system prompt with the rules, then a fresh state message each month containing year-to-date totals, last month's revenue and customer count, and (in the analytics bucket) three regression summaries computed from the simulator's internal daily stream. Conversation history is kept across all twelve months, the model sees everything it has previously said and observed. Decisions come back as strict JSON; parse failures are recorded and the run continues.
For reasoning-capable families (OpenAI's gpt-5 series, o-series, DeepSeek R1, Qwen3 thinking variants, Anthropic extended-thinking) the canonical setting is reasoning.effort = medium. For non-reasoning models, temperature is 0. Both choices are part of the canonical spec; overriding them produces non-canonical runs that don't pool into leaderboard averages.
Storage and verification
Run metadata, per-month turns, and full prompt/response traces land in Supabase (Postgres with row-level security). Every model's reasoning is queryable and replayable, the AI Replays page on this site streams the saved traces back month by month. Anyone with a clone of the repo and an OpenRouter key can re-run any model and check that the score reproduces.
Cost is tracked per run by diffing the OpenRouter /credits endpoint before and after. The per-generation cost field on individual completions is unreliable across upstreams, but the credits delta is exact, at the cost of being noisy if multiple runners share a key.
Bucketing and the analytics view
The two leaderboard buckets, no analytics and with analytics, differ in exactly one thing: whether the monthly state message includes three regression summaries (correlations, an OLS regression with weather and event controls, and an adstock-aware regression). The information content matches what a human in the analytics-enabled condition sees on the live site. Both buckets are required for a model to count as a canonical entry.
Frontend, hosting, deployment
The site is plain HTML, ES-modules JavaScript, and CSS, no framework. The 3D cafe scene at the top of the play page uses Three.js with custom isometric sprite work. Hosting is GitHub Pages; data reads go directly from the browser to Supabase via the public anon key with read-only RLS. There is no application server. The leaderboard query filters strictly on the canonical-config flag in run metadata, so research sweeps and legacy runs sit in the database but never surface on the public table.
Reproducing the leaderboard
Adding a model is one command:
OPENROUTER_API_KEY=sk-or-... node sdk/run.mjs \
  --model anthropic/claude-sonnet-4.6 \
  --submitter "Your Name"
The runner is idempotent, re-running the same model skips already-completed (model, seed, bucket) tuples. Cost lands between $0.20 and $20 depending on tier; the 29-model sweep behind this writeup ran on roughly $118 of OpenRouter credits across about a day of wall-clock time. The full canonical spec (route, temperature, max tokens, reasoning effort, seeds, conversation policy, provider pinning) is in BENCHMARK.md.
Related work
AttributionBench sits at the intersection of three existing literatures. Static causal-reasoning benchmarks ask whether LLMs can produce text consistent with a correct causal argument. Interactive agent benchmarks measure multi-turn decision-making against typically deterministic state transitions. Contextual-bandit studies probe stochastic reward but usually at horizons of one or two steps. None of these simultaneously tests sequential decision-making, stochastic aggregated feedback, and an applied causal structure with a well-defined oracle. The works closest to ours along each of these axes:
- Kıcıman et al., 2024. The canonical study of LLM causal reasoning: pairwise causal discovery, counterfactuals, and event causality, with strong gains over prior NLP methods. Differentiator: their evaluation is single-turn and text-only. AttributionBench measures whether a model can act on a causal hypothesis under partial observability, with seed-specific elasticities and adstock carryover that cannot be retrieved from training data.
- Zečević et al., 2023. The “causal parrots” counterargument: LLM gains on causal benchmarks may reflect memorized correlations between causal facts in training data, not genuine inference. Differentiator: our procedurally generated seeds make the per-seed elasticities un-memorizable. The two non-positive analytics-delta patterns we observe (Ministral-8B flat, GPT-4o-mini hurt) provide a quantitative yardstick for cases where causal vocabulary fails to translate into causal action.
- Yang et al., 2025 (AQA-Bench). An interactive turn-based benchmark where LLMs solve binary search, DFS, and BFS against a deterministic environment. The closest precedent for the turn-by-turn protocol shape: a fixed-step interaction loop scored against a known optimum. Differentiator: their state transitions are deterministic and reward is unambiguous; our environment is noisy aggregated feedback under hidden parameters, with no per-channel ground-truth signal.
- Chen et al., 2025 (MAPF as LLM Benchmark). Multi-agent path finding evaluated turn-by-turn against a rule-based simulator. The clearest precedent for the simulator-as-environment approach: an external program advances world state and feeds the agent a structured observation each step. Differentiator: MAPF state is fully observable; in our task the causal structure is hidden, and the agent only ever sees aggregated revenue rather than per-channel returns.
- Liu et al., 2024 (AgentBench). A broad LLM-agent suite covering web tasks, code, databases, and games across 25+ models. The most-cited reference point for “LLMs as agents in interactive environments.” Differentiator: AgentBench is a breadth benchmark spanning many qualitatively different environments. AttributionBench is the opposite: one stylized environment, evaluated deeply, with a closed-form oracle and a single capability (causal reasoning under noisy aggregated feedback) under test.
- Felicioni et al., 2024. LLMs as contextual-bandit policies, with uncertainty-aware sampling (Laplace, Dropout, Epinets) outperforming greedy prompting. Differentiator: their setting is a single-step bandit with synthetic features. AttributionBench is a 12-step sequential allocation with adstock carryover and a competing market actor, the action space is continuous (a 3-simplex of budget shares), and prior decisions create both information and a delayed-effect tail.
- Krishnamurthy et al., 2024. Empirical study of whether LLMs can explore in multi-armed bandit tasks specified through prompts. They find frontier models can explore effectively when actions have semantic content but underperform simple regression baselines on pure exploitation. Differentiator: theirs is a stateless MAB with discrete arms; ours is stateful sequential allocation where adstock carryover means current decisions partially determine future reward, and where regression summaries are themselves part of the experimental manipulation.
- Kapoor et al., 2025 (AI Agents That Matter). Methodological critique of the agent-benchmarking landscape: cost reporting, held-out adequacy, level-of-generality clarity, reproducibility. Differentiator: not a competing benchmark but a yardstick we measure ourselves against. We adopt the cost-reporting and narrow-scope-claim prescriptions; the public ten-seed set used here is the obvious risk surface for prompt-level overfitting, and a private held-out seed set is the largest outstanding response we still owe.
References
- Chen, W., Koenig, S., & Dilkina, B. (2025). Solving Multi-agent Path Finding as an LLM Benchmark: How, How Good and Why. Transactions on Machine Learning Research. openreview.net/forum?id=8hAxEFRVQT.
- Felicioni, N., Maystre, L., Ghiassian, S., & Ciosek, K. (2024). On the Importance of Uncertainty in Decision-Making with Large Language Models. Transactions on Machine Learning Research. openreview.net/forum?id=YfPzUX6DdO.
- Kapoor, S., Stroebl, B., Siegel, Z. S., Nadgir, N., & Narayanan, A. (2025). AI Agents That Matter. Transactions on Machine Learning Research. openreview.net/forum?id=Zy4uFzMviZ.
- Kıcıman, E., Ness, R., Sharma, A., & Tan, C. (2024). Causal Reasoning and Large Language Models: Opening a New Frontier for Causality. Transactions on Machine Learning Research. openreview.net/forum?id=mqoxLkX210.
- Krishnamurthy, A., Harris, K., Foster, D. J., Zhang, C., & Slivkins, A. (2024). Can Large Language Models Explore In-Context? Advances in Neural Information Processing Systems (NeurIPS). arXiv:2403.15371.
- Liu, X., Yu, H., Zhang, H., Xu, Y., Lei, X., Lai, H., Gu, Y., Ding, H., Men, K., Yang, K., et al. (2024). AgentBench: Evaluating LLMs as Agents. International Conference on Learning Representations (ICLR). arXiv:2308.03688.
- Yang, S., Zhao, B., & Xie, C. (2025). AQA-Bench: An Interactive Benchmark for Evaluating LLMs' Sequential Reasoning Ability in Algorithmic Environments. Transactions on Machine Learning Research. openreview.net/forum?id=W22g6Ksmbi.
- Zečević, M., Willig, M., Dhami, D. S., & Kersting, K. (2023). Causal Parrots: Large Language Models May Talk Causality But Are Not Causal. Transactions on Machine Learning Research. openreview.net/forum?id=tv46tCzs83.